Silicon Wafer Shipment Area Growth: The 2026 Recovery Trajectory
The silicon wafer market is recovering in 2026, but the recovery is neither uniform nor adequately explained by the artificial intelligence investment boom alone. Shipment area is increasing, advanced applications remain the strongest demand engine, and industrial and automotive markets are showing signs of improvement. Yet rising volumes do not automatically imply stronger pricing, fully utilized factories, or an equally healthy outlook across wafer categories.

The headline numbers establish the direction. Worldwide silicon wafer shipments reached 3,275 million square inches in the first quarter of 2026, increasing 13.1% year over year. Second-quarter shipments climbed to 3,573 million square inches, up 7.4% year over year and 9.1% sequentially. These results point to a continuing recovery, although the different growth rates also show why quarterly comparisons require context.
For wafer producers, chip manufacturers, and materials investors, the central question is now about breadth: can strength in AI-related applications develop into a more balanced recovery across mature-node devices, consumer electronics, and the wider semiconductor materials chain?
What Shipment Area Actually Measures
Silicon wafer shipments are commonly expressed in million square inches, or MSI. Area provides a more useful aggregate measure than wafer count because wafers come in different diameters. A 300 mm wafer contains substantially more surface area than a 200 mm wafer, so counting each as one unit would obscure their different manufacturing footprints.
The reported shipment series covers polished and epitaxial silicon wafers supplied by wafer manufacturers to end users. It does not include non-polished or reclaimed wafers. That boundary matters when comparing wafer shipments with other measures of semiconductor production or materials consumption.
Shipment area is nevertheless an upstream delivery measure, not a direct reading of chips sold or wafers processed. Customers can purchase wafers ahead of production, consume existing inventories, or change their procurement timing. Consequently, shipment growth should be interpreted alongside wafer starts, customer inventories, and end-market demand.
It is also important to distinguish area from economic value. Two square inches of silicon do not necessarily generate the same revenue when their specifications, processing requirements, and customer applications differ.
The Starting Point: Volume Recovered Before Revenue
The recovery did not begin from a clean slate in January 2026. Worldwide silicon wafer shipments increased 5.8% in 2025 to 12,973 MSI, while wafer revenue declined 1.2% to $11.4 billion. That divergence established an important starting condition: physical demand was improving faster than the industry's revenue performance.
This is not contradictory. Volume can recover while pricing remains subdued, contract adjustments lag, or the shipment mix shifts. Producers may deliver more area without capturing proportionately more value.
For a financial analyst, that distinction prevents an easy forecasting mistake. Applying shipment growth directly to revenue assumes that realized pricing and product mix remain constant. Applying it directly to earnings adds another assumption: that costs and utilization improve in a predictable way.
The 2026 recovery therefore needs to be assessed in stages. First comes stabilization in demand. Then comes stronger shipment volume. A more complete recovery requires evidence that this translates into improved commercial conditions and better operating performance.
Reading the First-Half Trajectory
The first-quarter result was stronger than the year-earlier comparison suggested about immediate momentum. Although shipments increased 13.1% year over year, they declined 4.7% from the fourth quarter of 2025, when shipments reached 3,437 MSI. The quarterly update characterized that sequential decline as consistent with typical seasonality.
The second quarter then delivered a clearer sequential improvement, with shipments rising 9.1% from the first quarter. Its lower year-over-year growth rate did not mean that the recovery had necessarily weakened; the prior-year comparison was also higher.
This is the practical value of examining both comparisons. Year-over-year growth helps reduce the distortion from recurring seasonal patterns. Quarter-over-quarter growth shows the latest directional movement, but can exaggerate strength or weakness when seasonal purchasing changes are significant.
Neither measure alone proves that the industry has entered a durable expansion. Together, however, the first-half results support a more constructive view than a simple stabilization narrative. The next test is whether customers sustain that demand without rebuilding excessive inventories.
AI Provides the Strongest Foundation
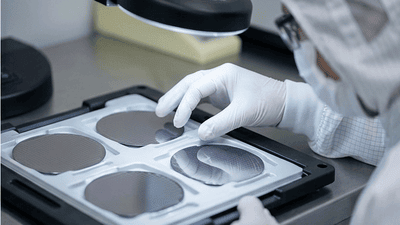
AI-related demand continues to support advanced logic and memory applications. The wafer market's recent growth has included advanced epitaxial wafers for leading-edge logic and polished wafers for high-bandwidth memory, or HBM. These are distinct product pathways, even though both benefit from investment in AI computing.
That distinction matters commercially. An AI accelerator and its memory system do not create one homogeneous wafer order. They generate demand across different device manufacturers, process flows, substrate specifications, and qualification requirements.
The influence is also extending beyond the central compute and memory devices. The second-quarter industry update identified AI-related demand in power devices, photonics, and other markets, suggesting a broader materials footprint around data-center infrastructure.
Even so, AI should not become an all-purpose explanation. The relationship between data-center investment and wafer area depends on what is manufactured, how much silicon each product consumes, and how effectively customers convert wafers into usable devices. Strong spending is an important demand signal, not a direct wafer-area conversion formula.
HBM Makes the Memory Recovery More Selective
HBM is particularly important because it connects wafer demand with the performance requirements of AI systems. Its contribution is not simply that more memory is needed. It also changes the commercial emphasis within memory production toward products serving bandwidth-intensive workloads.
However, strength in HBM should not be read as evidence that every memory segment is equally healthy. Consumer-oriented memory demand and AI-oriented memory demand can move differently, while manufacturers make allocation decisions across their product portfolios.
The 2026 quarterly commentary also highlighted a complication: memory price pressures were constraining PC and smartphone demand. An AI-led expansion can therefore coexist with less favorable conditions in consumer electronics.
For wafer suppliers, the resulting opportunity is selective. Exposure to qualified products used in expanding memory applications may matter more than a broad label such as “memory supplier.” The recovery depends on which customers are growing, which products they manufacture, and whether those gains offset weakness elsewhere.
Mature-Node Demand Determines the Recovery's Breadth
Industrial and automotive semiconductors are the other major test of the 2026 trajectory. The second-quarter update reported recovery in these markets, while the first-quarter commentary noted improving industrial conditions as wafer inventories were absorbed.
That is encouraging, but inventory normalization and a sustained end-demand expansion are different developments. A customer that has finished reducing stocks may resume purchases even if its underlying sales are only stable.
From a factory manager's perspective, this distinction is less abstract than it sounds. More regular orders improve production scheduling and reduce uncertainty. Yet a few replenishment orders do not necessarily justify a major expansion or establish durable pricing power.
A broader recovery would involve repeated orders, improving production activity, and less dependence on temporary restocking. Mature-node markets do not need to match AI's growth rate to matter. Their contribution would make the overall wafer cycle less concentrated and potentially more resilient.
Why Diameter and Specification Matter
A single global shipment figure can conceal very different business conditions. Wafer diameter, polished versus epitaxial products, electrical characteristics, defect requirements, and customer qualifications all influence the commercial value of a shipment.
The 2025 industry review described strong demand for 300 mm wafers in advanced applications alongside a slower stabilization in legacy semiconductor segments. This two-track starting point remains essential to interpreting the 2026 recovery.
It would nevertheless be too simplistic to assign every 300 mm wafer to AI and every smaller wafer to legacy demand. Diameter is a manufacturing platform, not an end-market classification. Product specifications and customer exposure provide a more precise picture.
For investors comparing wafer companies, aggregate market growth is therefore only the first layer of analysis. The more informative question is whether each supplier's qualified capacity matches the categories in which customers are actually increasing purchases.
Shipment Growth Is Not the Same as Pricing Power
The 2025 divergence between volume and revenue offers a useful warning for 2026. Higher shipments can improve production efficiency, but they do not automatically tighten supply enough to raise prices. The outcome depends on available capacity, customer commitments, competitive behavior, and the product mix.
Long-term commercial arrangements can also make revenue respond differently from near-term demand. A stronger operating environment may take time to appear in realized pricing, while weaker conditions may remain embedded in existing agreements.
From a producer's perspective, the most attractive recovery is one in which customers need more qualified area, factories run more efficiently, and pricing supports the cost of maintaining demanding specifications.
From an investor's perspective, those are separate variables. Shipment growth demonstrates expanding physical demand. Pricing indicates bargaining conditions. Margins reveal whether the combination is creating economic value. Treating them as interchangeable obscures the quality of the recovery.
The Link to Photoresists, Gases, and Targets
A wafer recovery matters beyond wafer manufacturers because silicon is the substrate entering many semiconductor process flows. As customers increase production, the implications can extend to photoresists, electronic gases, cleaning chemicals, and deposition materials.
However, these materials should not be forecast using one common growth rate. Their consumption depends on what happens after a wafer enters the fab. Process complexity, layer count, material choices, utilization, and yields can change the relationship between wafer area and chemical demand.
Photoresist demand relates to lithography activity and formulation requirements. Gas demand depends on the processes performed and the purity and delivery conditions required. Sputtering target demand reflects the deposition steps and materials used, rather than silicon area alone.
The useful analytical framework has two dimensions: more wafers moving through production and more demanding processes applied to those wafers. Either can support materials demand, but different suppliers benefit from different combinations.
Three Paths for the Rest of 2026
The remaining trajectory is best framed as scenarios rather than a falsely precise full-year conclusion. The quarterly figures establish progress through the first half; they do not, by themselves, determine the final annual result.
- A balanced recovery would combine continued AI-related demand with more consistent industrial and automotive orders. Shipment growth would become less dependent on a narrow group of advanced applications.
- An AI-heavy recovery would preserve strong momentum in selected logic and memory products while consumer and mature-node demand remained uneven. Aggregate area could improve without uniformly stronger supplier results.
- A restocking-led slowdown would emerge if customers replenished depleted inventories but failed to sustain higher production. Shipments could lose momentum after the initial purchasing rebound.
These paths are not predictions with equal probabilities. They are practical frameworks for separating durable consumption from procurement timing and for testing whether financial expectations match operating evidence.
The Indicators That Matter Next
The most useful monitoring approach combines the shipment series with customer and supplier disclosures. No single indicator captures the entire recovery, but several can help distinguish its underlying drivers.
- Compare year-over-year and sequential shipment growth rather than relying on one headline rate.
- Track whether customer inventories decline, stabilize, or begin rising again.
- Separate advanced logic and HBM demand from broader memory and consumer demand.
- Look for sustained improvement in industrial and automotive orders.
- Examine utilization, realized pricing, and revenue mix alongside shipment area.
Capacity announcements deserve scrutiny as well. Announced investment, installed equipment, customer-qualified capacity, and commercially productive output represent different stages. Additional capacity strengthens supply only when it is ready for the products customers require.
A Recovery Worth Measuring Carefully
The evidence from early 2026 supports a genuine recovery in silicon wafer shipment area. What remains unsettled is its commercial depth and its reach across the industry.
AI supplies a powerful foundation, but a healthier wafer cycle requires more than strong demand in its leading applications. Broader purchasing, disciplined inventories, and improving supplier economics would make the expansion more durable. For anyone following semiconductor materials, the key is not simply how much silicon ships, but where it goes and how effectively that volume becomes lasting value.