SK Hynix Q2 DRAM ASP Up 30%: The AI Server Demand Curve
SK hynix’s second-quarter DRAM pricing tells a broader story than the success of high-bandwidth memory alone. The company reported that DRAM average selling prices rose approximately 30% sequentially in the April–June 2026 quarter, with management attributing the increase primarily to continued strength in conventional DRAM. DRAM bit shipments increased by a high-single-digit percentage.
The distinction matters. AI infrastructure is creating demand not only for memory attached to accelerators, but also for the conventional DRAM supporting host systems, databases, and surrounding services. Meanwhile, manufacturers are deciding how to allocate limited resources among those products.
The central theme is scarcity, but scarcity expressed through product mix, qualification, and customer requirements—not simply an absence of memory chips. The 30% increase is a realized company-level pricing signal. Understanding its durability requires tracing the demand curve behind it.
What the ASP Figure Measures
Average selling price summarizes the revenue realized across a defined product basket. It is not necessarily the price change for one identical component purchased under identical conditions.
Different DRAM products can carry different values. A shift toward server products, higher-capacity configurations, or specialized memory can influence the average alongside increases in comparable-product prices.
The quarterly figure also differs from a spot-market quotation. It reflects the company’s actual commercial mix over the reporting period rather than one transaction or published benchmark.
For an analyst, the correct starting point is therefore the basket. A 30% increase does not establish that every DDR5 module, every HBM product, or every customer contract rose by exactly that amount.
Pricing Was More Powerful Than Shipment Growth
The combination of approximately 30% higher DRAM ASP and high-single-digit bit-shipment growth shows that pricing was a major revenue accelerator.
Using an illustrative 8% shipment increase, multiplying 1.30 by 1.08 produces approximately 40% revenue growth for a comparable basket. That is a simplified explanation, not a reconstruction of the company’s segment revenue.
Actual results can differ because product mix, currency, measurement conventions, and reporting categories also matter.
The lesson is nevertheless useful: a memory manufacturer can generate a large revenue increase without expanding physical output at the same rate. That creates powerful earnings leverage, but also makes the outlook sensitive to pricing.
The Company Results Show the Financial Impact
SK hynix reported second-quarter revenue of approximately ₩79.3 trillion and operating profit of ₩60.5 trillion. Revenue increased 51% sequentially, while operating profit rose 61%, producing a reported operating margin of approximately 76%. The company connected the results to higher DRAM and NAND prices and sales of high-value products, including HBM, AI-server DRAM, and enterprise SSDs.
These figures describe the whole company, not DRAM alone. NAND contributed its own pricing and shipment dynamics.
The stronger profit growth illustrates operating leverage: revenue improved faster than the cost base required to generate it.
For investors, the question is whether that leverage remains favorable as prices, costs, and product allocation evolve.
AI Servers Need Memory Outside the Accelerator
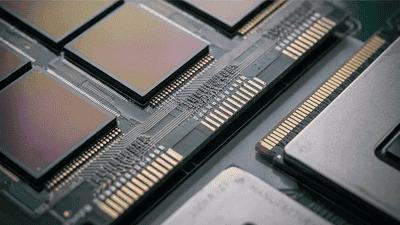
HBM is important to accelerator bandwidth, but the host system still needs working memory. Software execution, data preparation, orchestration, and database activity all create conventional DRAM requirements.
Those requirements vary by architecture and workload. A training system, inference platform, and retrieval-heavy service can use memory differently.
This makes the demand curve broader than accelerator shipments. It includes the number of memory-bearing systems and the capacity installed in each.
For a memory supplier, the opportunity is to serve qualified configurations across that infrastructure. For an analyst, the challenge is to estimate actual content rather than apply one generic memory figure to every AI deployment.
DDR5 Content Can Grow Faster Than Server Units
Total server-memory demand depends on system shipments and average installed capacity. When both rise, their effects compound.
A deployment using the same number of servers can consume more DDR5 if customers select larger modules or populate additional channels. Conversely, higher prices can encourage smaller configurations.
The resulting demand is therefore not determined by unit shipments alone.
From a procurement manager’s perspective, the relevant product is the module approved for the platform. From an investor’s perspective, the strongest signal is recurring adoption of higher-value configurations supported by real workload requirements.
Bandwidth and Capacity Drive Different Purchases

Some customers populate memory channels to obtain bandwidth. Others need larger working sets to remain in memory. Those goals can create different module choices.
Adding capacity does not guarantee proportional performance improvement, and a lightly populated system may have a different bandwidth profile from a more balanced configuration.
Processor support, module organization, and operating conditions influence the appropriate arrangement.
This is why demand should be modeled through configurations rather than aggregate bits alone. A supplier can have adequate total output while still facing strong demand for particular densities, organizations, or validated server products.
HBM Influences Allocation Without Explaining Everything
Manufacturers allocate investment, engineering resources, and production capability across their DRAM portfolios. Strong HBM demand can affect how quickly conventional products expand.
However, the relationship is not a universal one-for-one exchange between HBM and DDR5. Process technology, yields, equipment, and product architecture affect the actual trade-off.
SK hynix’s explanation of the quarter is especially informative because it identified conventional DRAM pricing as the main driver of the ASP increase.
For investors, that broadens the earnings thesis. The quarter was not solely a bet on premium stacked memory; conventional products also carried substantial pricing power.
Shipment Timing Affected the Blended Result
Management said shipments of some higher-value products moved into the second half, influencing the quarter’s product portfolio and blended ASP. It expected those effects to ease gradually as HBM4 and newer-process conventional DRAM shipments expanded.
This is an important limitation on interpreting one quarterly average. The mix delivered in a period may not represent the longer-term product opportunity.
A lower share of premium products can coexist with strong comparable-product pricing. A later mix improvement can raise revenue without requiring the same underlying price acceleration.
For analysts, timing and mix should therefore be separate variables. Otherwise, a change in blended ASP can be misread as a uniform change in customer pricing.
NAND Provided a Second Pricing Engine
SK hynix’s second-quarter NAND ASP increased in the mid-50% range, while bit shipments rose by a mid-teens percentage. Management described stronger pricing across products and a focus on higher-value storage demand.
That result must remain distinct from the 30% DRAM figure. NAND serves persistent-storage applications and follows its own allocation and technology dynamics.
The combined company performance therefore reflected more than one favorable market.
For investors, this can broaden the opportunity while complicating the forecast. DRAM and NAND may strengthen together, but they do not necessarily retain the same pace of price growth or face identical supply responses.
Enterprise SSDs Turn Flash into a Complete Product
An enterprise SSD combines NAND with controllers, firmware, interfaces, qualification, and support. Customers buy the finished behavior of that system rather than raw storage bits alone.
Endurance, reliability, latency consistency, and power characteristics can influence selection. These requirements make immediate supplier substitution more involved than a simple capacity comparison.
AI-related workloads create several storage needs, including datasets, checkpoints, retrieval information, and operational records.
For SK hynix’s broader storage business, the opportunity depends on products that match those workloads. A general increase in data-center spending is useful context, but recurring qualified deployment determines the commercial benefit.
DDR5 and SSDs Share a Budget, Not a Function
Working memory and persistent storage perform different jobs. A server needs an appropriate balance rather than an interchangeable pool of capacity.
Higher prices in both categories can influence system economics. Customers may optimize software, revise configurations, or prioritize deployments according to their expected value.
Some architectures can move less active information toward storage, but that requires suitable software and accepts a different performance profile.
For analysts, the connection is architectural and financial. DDR5 growth should be modeled through working-memory requirements, while SSD demand should follow persistent data, performance, resilience, and deployment needs.
Demand Resilience Does Not Mean Price Insensitivity
Enterprise customers can have strong reasons to proceed with infrastructure purchases. A required deployment may create value far beyond the incremental cost of memory.
That can make demand more resilient than a discretionary consumer upgrade. It does not make buyers indifferent to cost.
Customers still negotiate, improve utilization, qualify alternatives, and revisit specifications.
The sustainability of the 30% ASP increase therefore depends on the supply available and the customer’s ability to adapt. Pricing power persists when approved products remain necessary and difficult to obtain—not merely because the market is described as AI-driven.
Inventory Can Distort the Apparent Curve
Buyers sometimes purchase ahead of deployment to secure supply. That can raise manufacturer shipments while building buffers at system vendors or end customers.
Later, those inventories can support activity without equivalent new orders.
This creates a difference between procurement demand and consumption. Both are commercially important, but their persistence differs.
For an investor, the stronger signal combines pricing with deployment and inventory evidence. A procurement surge can support an excellent quarter while leaving more uncertainty about the next period than the revenue result suggests.
The Supply Response Takes Several Forms
Manufacturers can increase usable output through new capacity, process transitions, better yields, and improved utilization. Each route has a different schedule.
New facilities require equipment, staffing, qualification, and ramp-up. Technology transitions can improve density, but they need stable production before the benefit reaches customers.
Additional output can eventually moderate the scarcity supporting ASP. The timing determines how long the current commercial conditions last.
For analysts, qualified supply is the appropriate denominator. Announced wafer capacity and expected density improvements should not be treated as immediately available server memory.
Valuation Requires More Than Strong Current Earnings
A stock reflects expectations about future performance. Exceptional reported profit can still disappoint if investors expected something stronger.
Conversely, a slowing price increase can remain commercially favorable while weakening the stock’s earnings-surprise profile.
The distinction is particularly important when margins are unusually high. A valuation based solely on current earnings may understate the risk of normalization.
For investors, the useful exercise tests several pricing, shipment, and cost conditions. The goal is to identify what portion of profitability comes from durable product value and what portion depends on temporary market tightness.
A Dashboard for the Next Phase
The most informative indicators connect the headline ASP with actual operating drivers.
- Track conventional DRAM pricing separately from the HBM mix.
- Compare bit shipments with customer deployment and inventory.
- Follow qualified DDR5 module demand by configuration.
- Separate NAND ASP from finished enterprise SSD economics.
- Assess yield and accepted output rather than nominal capacity alone.
- Examine cash generation after necessary investment.
These measures help distinguish a broadening earnings base from a quarter amplified by timing and scarcity.
Three Possible Readings of What Comes Next
A sustained-tightness scenario combines strong server demand with gradual qualified supply expansion. Pricing remains supportive, though its rate of increase can vary.
A mix-led scenario involves greater delivery of premium products while conventional pricing moderates. Blended ASP can remain favorable for a different reason.
A rebalancing scenario emerges if output increases faster or customers adjust purchasing and configurations. Shipment growth may continue while pricing power weakens.
These are analytical frameworks rather than forecasts with assigned probabilities. Their value is to identify which evidence would change the interpretation.
The Demand Curve Extends Beyond HBM
SK hynix’s approximately 30% sequential DRAM ASP increase demonstrates that AI infrastructure was supporting pricing beyond accelerator memory. Conventional DRAM contributed directly, while NAND and enterprise SSDs supplied another growth pathway.
The result is powerful evidence of favorable conditions, not proof that the same quarterly increase will repeat.
The lasting opportunity depends on qualified products, resilient customer requirements, and disciplined supply expansion. Understanding those mechanisms makes the demand curve more useful than the headline alone.